Written and engineered by WPAgency Studio
When the Whole Grid Turns Green
A September 2026 local-search measurement from a system WPAgency.xyz has maintained since 2021, and what an Average Rank of 1.0 does and does not tell us.
Every sampled point was green.
On 6 September 2026, a Semrush Map Rank Tracker scan for Roseville Landscape Material Supply returned an Average Rank of 1.0 for the keyword landscaping supply store. Good: 100%. Average: 0%. Poor: 0%. Out of Top 20: 0%. Share of Voice: 27%. Every marker on the visible map reads 1, from Vineyard Road in the north down to the Interstate 80 corridor.
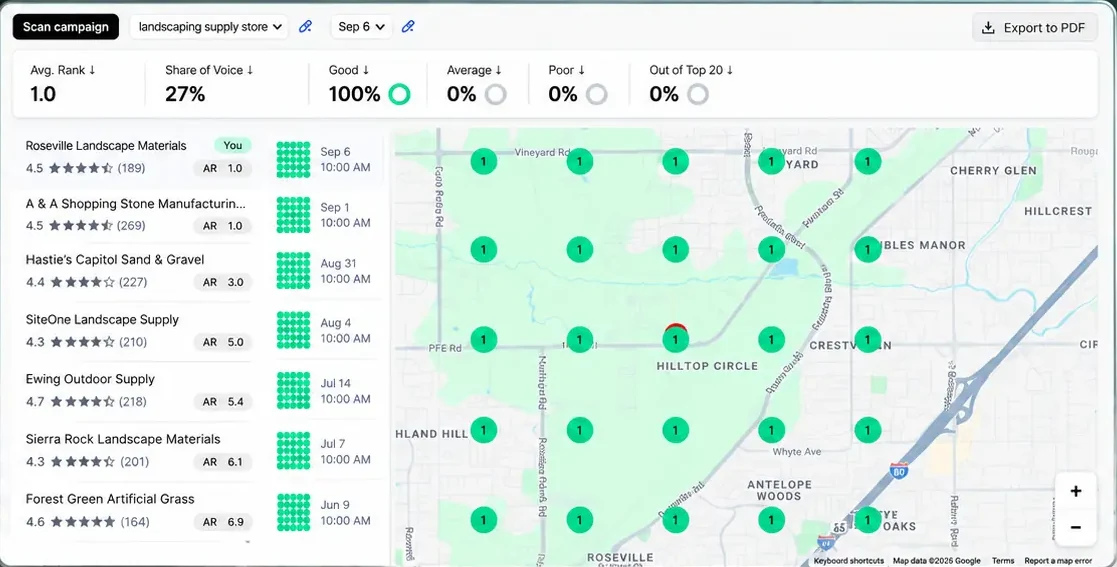
Semrush Map Rank Tracker, 6 September 2026. Average Rank 1.0 across the configured Roseville-area grid for landscaping supply store, with 100% of tracked points classified Good. The business is listed under its Google profile name, Roseville Landscape Materials. The panel is the tool’s own view, uncropped apart from its surrounding chrome. On a small screen the figures are easier to read from the scan at full size.
The engagement is not the Studio’s. It belongs to WPAgency.xyz, the agency this site is the creative research and product arm of, and its case study covers the client problem, what was built and why. This entry is the other half of the same work: what a measurement like this actually is, what it supports, and where it stops.
One search is not a map
Typing the keyword into Google from your own desk is a weak test, and it is the test almost everybody runs. It tells you what one query returned, from one location, on one device, in one session, with whatever history and signals that session carried. If the office happens to sit near the business, the answer is close to guaranteed and close to worthless.
Local results are geographic. The same three-pack query, issued from two points four miles apart, can return two different sets of businesses in two different orders, because proximity is an input rather than a tiebreaker. A single check samples that surface once.
A grid samples it repeatedly. The tracker issues the same query from a lattice of coordinates spread across the service area and records the business’s position at each one, then summarises the lattice: an average across points, and the distribution of those points into bands. What comes back is not a ranking. It is a map of one query’s behaviour across a territory, on a date.
The interesting number is the consistency
Position one is the least interesting thing in the panel above.
What the scan records is that position one held from point to point. Nothing in the sampled area came back Average, Poor, or outside the top twenty, which is a statement about distribution rather than about a peak. A business can hold a strong average while collapsing at the edges of its service area, where a competitor sits closer to the searcher; the shape of that failure is normally visible as a fringe of yellow or red around a green centre. There is no fringe here.
The second thing the panel records is repetition. Seven scans sit in the history column, from 9 June to 6 September, and each thumbnail is a grid of green dots. The same measurement, repeated across three months, produced the same shape.
That is the observation. The interpretation is narrower than it looks: a result that is stable across both space and time is more likely to be produced by something structural than by a good week, an algorithm flutter, or one competitor’s temporary problem. Stability is evidence of a system, and it is evidence available nowhere in a single check.
The limit sits right behind it. Repeatability establishes that the measurement is not noise. It does not establish what produces the result, and it does not extend past the keyword and the area that were configured.
The website did not do this alone
The temptation is to draw a straight line from the build to the map: the site was migrated from WordPress to Astro, the site got fast, the grid went green. The line is not there to draw.
The site is one layer. Around it, by WPAgency.xyz’s own account of the engagement, are the pieces that local search actually reads: a Google Business Profile built out with accurate categories, service areas and attributes and kept current; business information made consistent across local directories; content written for the service area rather than for a generic national page; structured data; an English and Spanish architecture served as two first-class language versions with their own URL paths rather than a translation plugin bolted on; and the reviews and ongoing activity of a business that is actually trading.
Every one of those is a maintained surface rather than a delivered asset. The honest version of the lesson is not that Astro produced an Average Rank of 1.0. It is that technical quality is necessary and nowhere near sufficient. A fast, accessible, well-marked-up site with a neglected business profile behind it will not hold a grid, and neither will an immaculate profile pointing at a slow site. The measurement sits on top of the whole arrangement, which is exactly why no single layer can claim it.
Tools that answer the question someone arrived with
The part of this build that interests the Studio most is not the SEO work. It is the three tools, because they were not built for search at all.
A materials calculator turns dimensions into cubic yards, square feet and tons. A Material Estimator takes a measured area and returns volume, equivalent bag count and estimated weight, with a buffer for waste and settling, and a price check beside it. An Order Builder assembles several materials into one job, tracking total volume and weight against the delivery threshold, and hands the yard a structured quote request instead of a phone call that begins “I’m not sure how much I need.”
None of those exist to place a keyword on a page. They exist because the questions are real and repetitive, and because the operational goal of the engagement was to take that repetition off the phone. The customer arrives from search holding a question the business has answered a thousand times, and the site answers it without anybody picking up.
The engineering principle underneath is worth stating plainly, and worth stating carefully. A page that resolves the visitor’s actual problem is a better page, and a site made of those pages is a better site. That is a claim about usefulness, which we can observe directly. It is not a claim that a calculator is a ranking factor, which we cannot observe at all, and which nothing in this measurement could support. Useful and ranked are two different axes that happen to correlate often enough to be worth confusing, and they are worth keeping apart anyway.
Four years is part of the architecture
The engagement began in 2021 and is still running. That is not a footnote to the measurement; it is most of the explanation.
Local authority is a slow-compounding asset. Citations get corrected. Profile information drifts and is pulled back. Service-area content accumulates. Product information gets updated when prices and catalogue change. Reviews arrive because the business keeps serving customers. Technical work happens again, because platforms move. None of it is dramatic, most of it is unglamorous, and all of it is the thing being measured.
Which makes the standard framing of search work, as a project with a launch date and a completion date, the wrong shape for the problem. You cannot ship maintenance. A grid that stays green over four years is not the output of a weekend audit followed by silence; it is the output of somebody having continued to care, on a schedule, for long enough that the pieces started reinforcing each other.
What the green grid does not tell us
This is a measurement note, so the honest inventory matters more than the result.
The panel does not tell us which intervention produced which movement. Several layers changed over four years, mostly in parallel, with no control market to compare against. Anyone claiming a clean attribution from data like this is guessing with confidence.
It does not tell us what tomorrow looks like. Local results change. The scan is dated, deliberately, and this entry names its date in every place it states a number.
It does not tell us how the business performs for every query. One keyword was configured. Landscaping supply store is not decomposed granite near me, and neither is the Spanish equivalent.
It does not tell us what 27% Share of Voice means commercially. Share of Voice is the tool’s own composite of how often and how prominently a business appears across the scanned grid, relative to the other businesses the scan saw. It is not 27% of the Roseville market, of local demand, or of anyone’s revenue.
It does not tell us about conversion, calls, orders or money. Nothing in a rank tracker measures a sale.
And it does not tell us that the business stands alone at the top. The same panel lists another supplier in the market at an average rank of 1.0 for the same keyword and the same grid. Two businesses cannot both hold position one at a single point, so at least one of those figures is a rounded average rather than a clean sweep. That is a useful reminder about summary statistics in general: 1.0 is a number the tool computed and rounded, not a trophy. The competitor list is context, not a scoreboard, and the rest of it reads between 3.0 and 6.9 on the day.
What the measurement does establish is narrow and genuinely worth having: for this tracked configuration, across this grid, on this date and on six earlier dates going back to June, visibility was consistent at or around the first position. Anything beyond that sentence is inference, and should be labelled as inference.
One more note on numbers. WPAgency.xyz’s case study quotes an earlier snapshot, with different review counts and different competitor positions. That is not a contradiction to reconcile. Review totals grow, competitors gain and lose ground, and a local grid is a moving measurement. The figures in this entry are the ones visible in the September panel above, and they belong to that date.
The surface, and the system underneath
A green grid is not the product. It is one observable output of a system that has been maintained long enough for its parts to compound: a fast site, a maintained profile, a bilingual content surface, tools that answer real questions, and four years of unglamorous correction behind all of it.
The website is the part everyone can see, which is why it tends to get the credit. It is the surface. The measurement is a reading taken off that surface, on a Tuesday in September, with a tool that samples a market from a lattice of points and rounds what it finds. Both are worth having. Neither is the work.
The same discipline the Studio applies to its own published measurements applies here: report what the instrument recorded, name the configuration it recorded it under, and keep the inferences separate from the readings.
The client’s side of this, the problem, the build and the business outcome, is written up where it belongs: Read the full Roseville Landscape Material Supply case study on WPAgency.xyz →